Electricity bills can rise even when rooftop solar panels produce more energy than a home needs at midday. A solar battery stores some of that surplus for later, such as when lights, cooking, and heating increase evening demand. This shifts more solar power into the hours when a household might otherwise draw electricity from the grid. The result depends on local electricity prices, utility rules, and how the system is used.
So, how does solar battery storage reduce electricity costs? It can lower grid purchases by supplying stored energy during expensive peak periods or after sunset. In some areas, this matters because exported solar power earns less than electricity costs to buy back. Savings are not automatic. Battery losses, equipment costs, installation, and gradual capacity decline all affect the financial picture. A battery that is too small may empty before peak rates begin; one that is oversized may take longer to pay for itself. Details matter.
A reliable estimate starts with real household data. Review several months of bills, hourly usage if available, rate plans, and solar production before choosing a battery. For example, a family that runs a dishwasher after dinner may benefit from stored afternoon generation, while a home with low evening use may see less value. Ask installers to explain their assumptions and compare projected savings with and without a battery. Results vary. This guide explores the practical choices, costs, and limitations that help homeowners decide whether storage fits their needs.
How Solar Battery Storage Reduces Electricity Costs
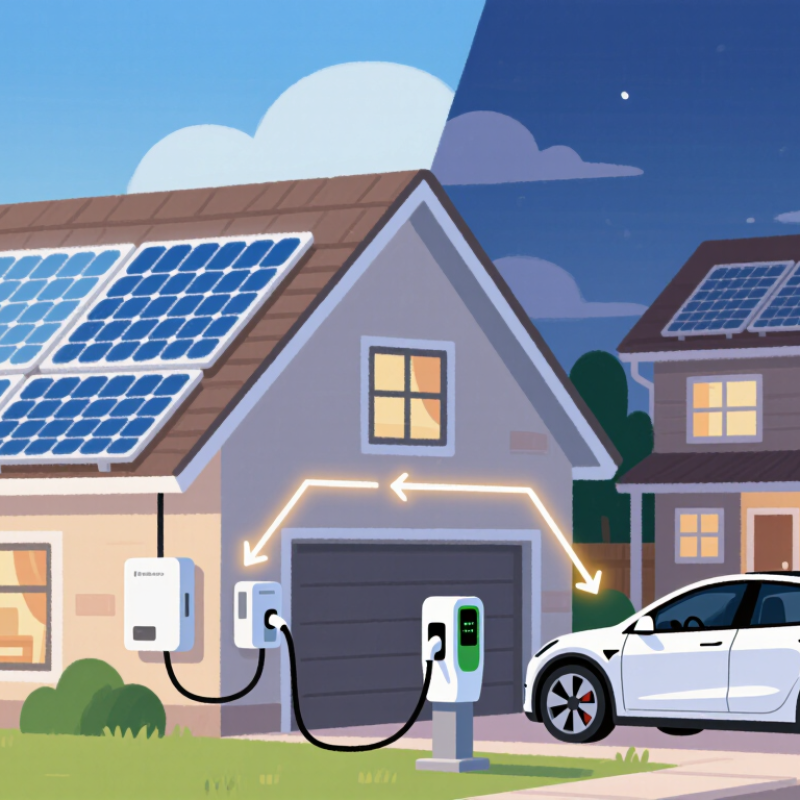
A solar battery can reduce electricity costs by saving rooftop power for the hours when household demand rises. Instead of sending excess midday generation to the grid, the system stores it and supplies evening lighting, cooking, or air-conditioning later. This can reduce purchases during expensive peak periods. The savings depend on your utility’s tariff and export credits, not just the battery’s capacity.
The U.S. Energy Information Administration reported an average residential electricity price of 16.0 cents per kilowatt-hour in 2023, though local rates differ considerably. Check your own bill for time-of-use prices before estimating savings. NREL’s 2024 Annual Technology Baseline models utility-scale lithium-ion batteries at 85% round-trip efficiency; household systems vary, but the figure illustrates that some stored energy is lost. A battery is not automatically cheaper. Its cost, usable capacity, and replacement timeline matter, too.
Tips: Compare peak and off-peak rates, then estimate how many evening kilowatt-hours the battery can actually supply. Check export credits and seasonal solar output. A spreadsheet helps. Still, estimates can miss cloudy weeks or changing habits, so treat projected savings as a range, not a promise.
Assessing Household Energy Use and Electricity Tariffs
Start with twelve months of electricity bills, not the battery’s advertised capacity.
EIA’s 2020 Residential Energy Consumption Survey put average U.S. household use at
10,566 kWh annually.
Treat that as context, not a sizing rule. Compare it with your own meter data, then mark when electricity is used. Evening cooking, laundry, and electric-vehicle charging can create a sharp after-sunset peak. Small details matter. A monthly total can hide the hours that drive your bill.
Next, read the tariff line by line.
EIA’s Electric Power Monthly reported an average U.S. residential electricity price of
16.0 cents per kWh in 2023,
but local rates differ. Check time-of-use peak and off-peak prices, fixed charges, demand charges, and credits for exported solar power. A battery may shift solar energy into costly evening hours, but savings depend on those tariff rules and actual usage. A first-pass spreadsheet can still miss seasonal changes, such as winter heating or summer air-conditioning. Recheck the estimate against several months of bills before choosing a battery size.
Choosing a Battery Capacity and System Configuration
Choosing battery capacity starts with your evening electricity use, not your home’s total daily consumption. Check a few weeks of interval data, if available, and note what runs after sunset. A refrigerator, lights, and a router need less energy than an electric vehicle or heat pump. Small details matter. A kettle can briefly draw substantial power, even though it runs for only minutes.
Compare usable capacity with the energy you want to shift into evening hours. The battery’s power rating also matters: capacity tells you how long it can supply energy, while power indicates how many appliances it can run at once. Allow for conversion losses and keep a reserve if backup power matters. For lower bills, using stored solar energy during expensive evening periods may help, but savings depend on your tariff and household habits. A cloudy week can expose an undersized system. I would avoid sizing from one unusually sunny month; that was an easy assumption to make, and a poor one. Confirm inverter compatibility, expansion options, and installation limits with a qualified professional before choosing a configuration.
How to Reduce Electricity Costs With Solar Battery Storage
Choosing a Battery Capacity and System Configuration
This illustrative model compares usable battery capacities in a solar self-consumption setup. It assumes stored solar energy replaces grid electricity priced at $0.30 per kWh, with estimated monthly grid imports avoided of 160, 275, and 320 kWh respectively. Actual savings depend on solar production, household usage, utility rates, battery efficiency, and system configuration. Larger batteries may deliver diminishing returns if there is not enough surplus solar energy to charge them.
Managing Solar Charging and Battery Discharge
Managing solar charging and battery discharge starts with your electricity tariff, not a fixed timer.
Check when your utility charges the most, then compare those hours with your household’s usual demand. A simple monitor can reveal whether cooking, laundry, or air conditioning drives the evening peak. Keep enough battery reserve for essential overnight loads, but avoid leaving so much unused that midday solar spills to the grid. Every home differs.
On sunny days, let surplus rooftop solar charge the battery; schedule discharge for costly evening hours. NREL’s 2024 Annual Technology Baseline models lithium-ion battery round-trip efficiency at about 85%, a useful benchmark rather than a guarantee for home systems. Some energy is lost during storage, so unnecessary cycling can erode savings.
Clouds complicate the plan. Review actual battery and meter data each month, especially after seasonal changes. A forecast can help, but it will not perfectly predict weather or family routines. Set a modest backup reserve, then adjust it after observing real outages, bills, and solar exports.
The first schedule may be wrong. That is useful information.
Tracking Savings and Maintaining the Storage System
Track savings in kilowatt-hours, not just the battery app’s percentage. Each month, note grid imports, exports, battery charging, and peak-hour discharge. Compare those figures with your utility bill and the same month last year. The U.S. Energy Information Administration reported an average residential electricity price of 16.41 cents per kilowatt-hour in 2023. Your own time-of-use rates may differ sharply. For example, shifting 8 kWh from a 30-cent peak period to a 12-cent off-peak period represents $1.44 in gross daily savings. That is not net savings: charging losses, export credits, and fees change the result. A spreadsheet can still mislead.
Maintenance makes those comparisons more useful. Check system alerts weekly, then look monthly for unusual drops in solar production or battery discharge. Keep vents clear and follow the installer’s guidance for inspections; do not open electrical equipment yourself. NREL’s review of photovoltaic degradation found a median decline of about 0.5% annually across the studies it examined. That figure describes panels, not batteries, but weaker solar output can affect how often a battery charges. Record outages, unusual weather, and rate changes too. Small details matter. I sometimes forget to log a bill promptly, so I mark the review date on my calendar. Compare several months before judging performance; one cloudy week is a poor verdict.
How to Reduce Electricity Costs With Solar Battery Storage - Tracking Savings and Maintaining the Storage System
Illustrative 12-month tracking example for a home with a 10 kWh usable battery. Estimated bill savings are calculated as battery energy delivered to the home multiplied by the assumed avoided grid electricity rate. Actual results vary with local tariffs, system performance, weather, and household energy use. Figures exclude installation costs, export credits, taxes, and battery degradation.
| Month |
Battery Energy Delivered (kWh) |
Avoided Grid Rate (USD/kWh) |
Estimated Bill Savings (USD) |
Storage System Check or Maintenance |
| January |
190 |
$0.30 |
$57.00 |
Review the monitoring app for alerts and confirm normal charge and discharge operation. |
| February |
180 |
$0.30 |
$54.00 |
Check that the area around the battery is dry and its ventilation openings are unobstructed. |
| March |
230 |
$0.31 |
$71.30 |
Compare battery discharge with household usage and note any unexpected change in performance. |
| April |
260 |
$0.31 |
$80.60 |
Visually check accessible exterior surfaces for damage; do not open the battery enclosure. |
| May |
300 |
$0.32 |
$96.00 |
Review the reserve setting so the battery retains the desired backup capacity. |
| June |
320 |
$0.33 |
$105.60 |
Check for monitoring alerts and confirm the system is following its configured operating schedule. |
| July |
330 |
$0.34 |
$112.20 |
Keep the battery within the temperature and clearance conditions specified in its owner's manual. |
| August |
310 |
$0.34 |
$105.40 |
Review monthly energy and bill data; contact a qualified technician if a fault alert persists. |
| September |
280 |
$0.33 |
$92.40 |
Check that exterior access remains clear and that no new obstruction blocks ventilation. |
| October |
250 |
$0.32 |
$80.00 |
Recheck backup reserve and time-of-use settings before seasonal household usage changes. |
| November |
210 |
$0.31 |
$65.10 |
Review the monitoring history for unexpected downtime or repeated charge and discharge interruptions. |
| December |
190 |
$0.30 |
$57.00 |
Check the system's service schedule and arrange professional inspection if it is due. |
| Annual Total |
3,050 |
— |
$976.60 |
Keep monthly energy and maintenance records to compare performance year over year. |
Conclusion
Solar battery storage can reduce electricity costs by saving excess solar power generated during the day for use in the evening or at other times when electricity rates are higher. To make the system effective, households should first review their energy use and electricity tariffs, including when they consume the most power and how rates change throughout the day. This helps determine how does solar battery storage reduce electricity costs for a particular home and whether shifting usage can increase savings.
Choosing a suitable battery capacity and system configuration depends on household demand, solar production, and budget. Smart charging and discharge settings can prioritize stored solar energy during expensive periods while keeping an appropriate reserve. Regularly tracking electricity bills, battery performance, and solar output helps measure savings and identify changes in usage. Routine maintenance and occasional system checks can also support reliable operation over time.

 Ansar Energy