Solar batteries store daytime energy for evening use, but their output depends on more than the panel rating. Temperature, battery chemistry, charge settings, age, and daily energy use all shape real-world results. A battery in a cool, ventilated utility room may behave differently from one in a hot garage. Small details matter. Understanding what factors affect solar battery performance helps homeowners make practical changes instead of guessing.
This guide explains how to improve solar battery performance through careful monitoring, appropriate system settings, and routine maintenance. It covers useful habits, such as checking charge levels and reviewing energy use during cloudy periods. It also explains why manufacturer guidance matters: lithium-ion and lead-acid batteries do not share identical charging needs. Avoid deep discharges when your system instructions recommend otherwise, and keep vents clear where required. If readings change suddenly or the battery becomes unusually warm, contact a qualified solar professional rather than adjusting unfamiliar wiring. Even careful owners may miss a setting or overlook a gradual decline. That is worth admitting. No single tweak guarantees better performance, but informed decisions can help a system store and deliver energy more reliably over time.
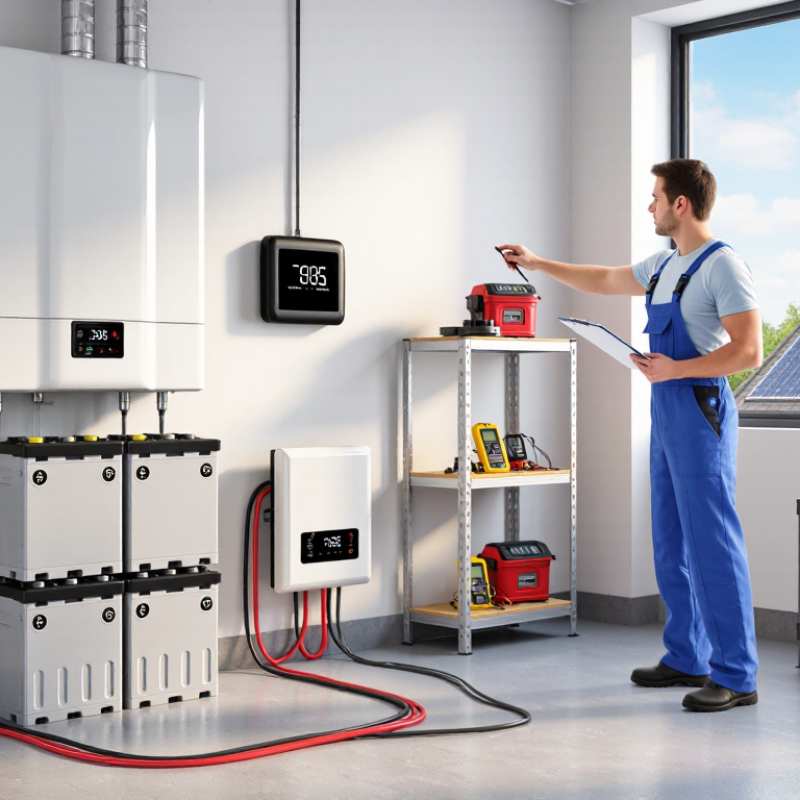
To improve solar battery performance, establish a measured baseline before changing settings. Lithium-ion batteries commonly achieve about 85–95% round-trip efficiency, but this is a benchmark, not a guarantee. Actual results depend on temperature, battery age, inverter losses, and how efficiency is measured.
Track energy entering and leaving the battery over several complete charge-and-discharge cycles. Use the same meter and measurement points each time. Divide delivered energy by charging energy, then multiply by 100. Keep notes on cloudy days, unusually high household demand, and cold nights. Small details matter. A reading that includes inverter standby use may look worse than one that excludes it, so compare like with like. Check the equipment’s monitoring data against a separate meter when practical.
A baseline can still be messy. Meter tolerances, partial charging, and changing weather can distort a single cycle. Record the battery’s temperature and state of charge, and compare weekly averages rather than chasing one surprising number. If measured efficiency falls below the expected range, inspect connections, charging limits, and idle loads before assuming the battery is failing. Then change one setting at a time and repeat the same measurement. This makes improvements easier to verify, though it cannot remove every source of uncertainty.
| Performance dimension | Baseline or benchmark | How to measure | How to interpret or improve it |
|---|---|---|---|
| Round-trip efficiency (RTE) | 85–95% is a commonly used benchmark range for lithium-ion battery systems; actual results depend on the system boundary and operating conditions. | RTE = energy discharged ÷ energy charged × 100. Compare readings over a complete charge-and-discharge cycle using the same meter locations. | Check whether readings include inverter and auxiliary losses. Compare like with like, and use the battery and inverter specifications as the system-specific reference. |
| Energy lost per cycle | At 85–95% RTE, losses equal 5–15% of the energy charged, calculated as 100% minus RTE. | Energy lost = energy charged − energy discharged, measured over the same cycle and system boundary. | A rising loss figure can indicate changed operating conditions, measurement differences, conversion losses, or a developing system issue. Verify meter accuracy before troubleshooting. |
| Charge and discharge energy | Record actual energy in kilowatt-hours (kWh); there is no single universal daily value because it depends on battery size, solar generation, loads, and settings. | Log charge input and discharge output for each cycle, along with the date, state of charge, and meter location. | Use matched time periods and consistent measurement points. This creates a meaningful site-specific baseline rather than comparing unlike systems. |
| Usable capacity | Use the battery’s specified usable capacity and permitted state-of-charge window; usable capacity is not necessarily the same as nominal capacity. | Measure energy delivered between the configured upper and lower state-of-charge limits under documented conditions. | Check the system’s reserve settings and operating limits. Do not change them beyond the manufacturer’s guidance to increase apparent capacity. |
| Operating temperature | Record battery temperature during charging and discharging; allowable ranges vary by battery design and must be taken from its technical documentation. | Log temperature alongside power, energy, and state-of-charge data. Use the battery’s own sensor readings where available. | Keep the installation within specified temperature limits and ensure ventilation and environmental controls are working as designed. |
| Standby and auxiliary energy | Measure the system’s own consumption; there is no universal benchmark because inverter, controls, and operating mode differ. | Record energy drawn while the battery is idle over a defined interval, such as one full day, and note which components are included. | Compare like operating modes and review unnecessary always-on loads or configuration issues without disabling required safety functions. |
| Cycle and measurement consistency | Establish a repeatable test window and record starting and ending state of charge, temperature, and operating mode. | Use calibrated energy meters where practical and retain time-stamped readings from the same measurement points. | Consistent test conditions make changes in RTE and capacity easier to distinguish from normal variation in solar input, loads, and system operation. |
Note: The 85–95% figure is a general lithium-ion system benchmark, not a guarantee for a particular installation. Follow the battery and inverter documentation for rated limits and test procedures.
About 85–95% is a common benchmark, not a promise. Temperature, battery age, and inverter losses can change the result.
Record energy going into and coming out of the battery over several complete cycles. Use the same meter and measurement points each time. Divide delivered energy by charging energy, then multiply by 100.
Cloudy weather, cold nights, partial charging, and household demand can affect a single cycle. Standby use may also be included in one measurement but excluded from another. Compare weekly averages.
Review several weeks of energy data and separate evening use from daytime use. Allow for reserve capacity and conversion losses. One mild week is a shaky basis.
It offers context, not a personal target. Cooking, heating, cooling, and vehicle charging can change daily needs considerably.
Yes. Check both usable capacity and output power. A kettle, pump, and refrigerator starting together may create a brief peak.
It is commonly used as an end-of-life benchmark, but it is not a universal replacement rule. Check how your system defines and estimates capacity.
Record displayed capacity and overnight energy use over several months. Compare similar conditions, including temperature and charging levels. A single app reading can mislead. Keep dated notes.
Improving solar battery performance starts with understanding how the system behaves in everyday use. Establish a baseline by comparing measured efficiency with the typical 85–95% range for lithium-ion batteries, while recognizing that actual results vary with operating conditions. Consider what factors affect solar battery performance, including battery sizing, charging settings, temperature, and changes in capacity over time. Match usable capacity to daily energy needs and peak demand so the battery can supply power reliably without being routinely undersized or unnecessarily oversized.
Follow the manufacturer’s recommended charging limits and depth of discharge to help protect battery life. Temperature also matters: capacity ratings are often based on conditions around 25°C, so performance may differ in hotter or colder environments. Track usable capacity and other health indicators over time, using the common 80% remaining-capacity level as a reference point for end of life rather than as a universal cutoff. Regular monitoring helps identify changes early and supports informed maintenance decisions.

 Ansar Energy